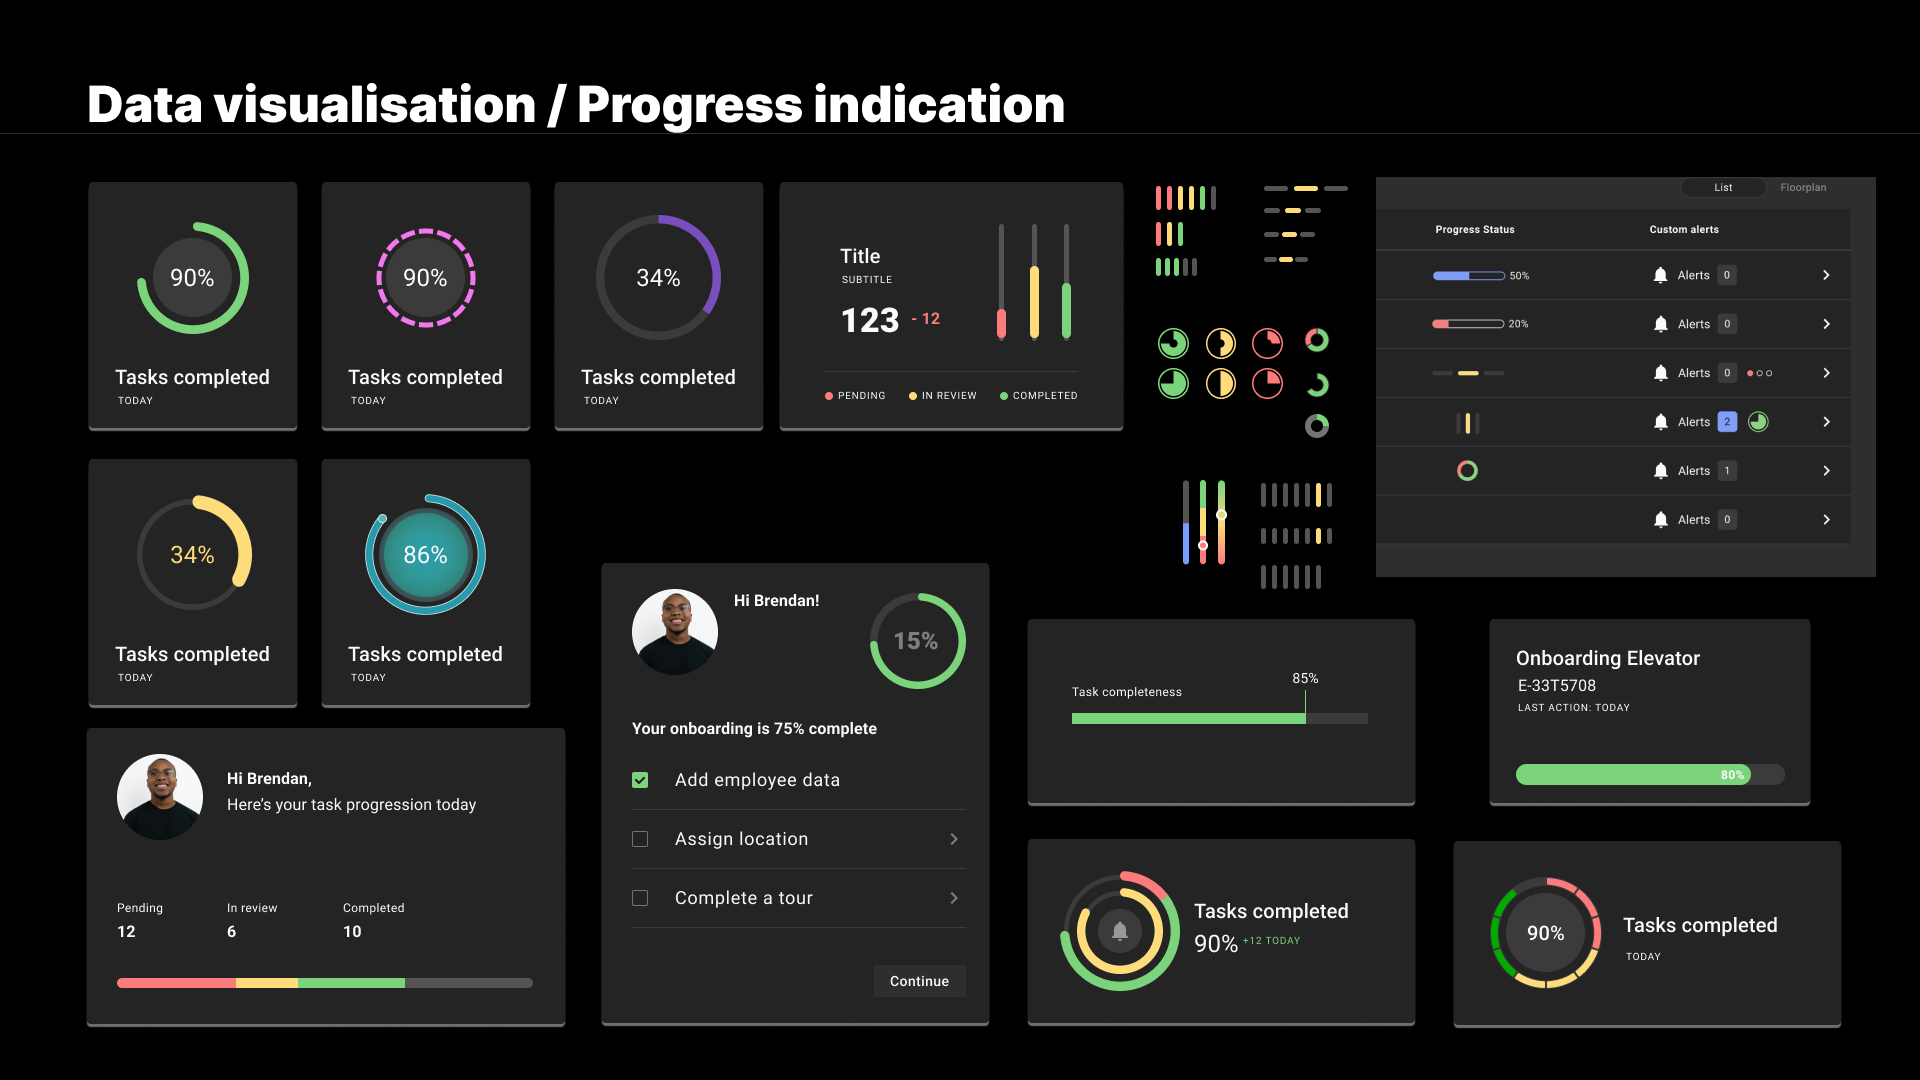
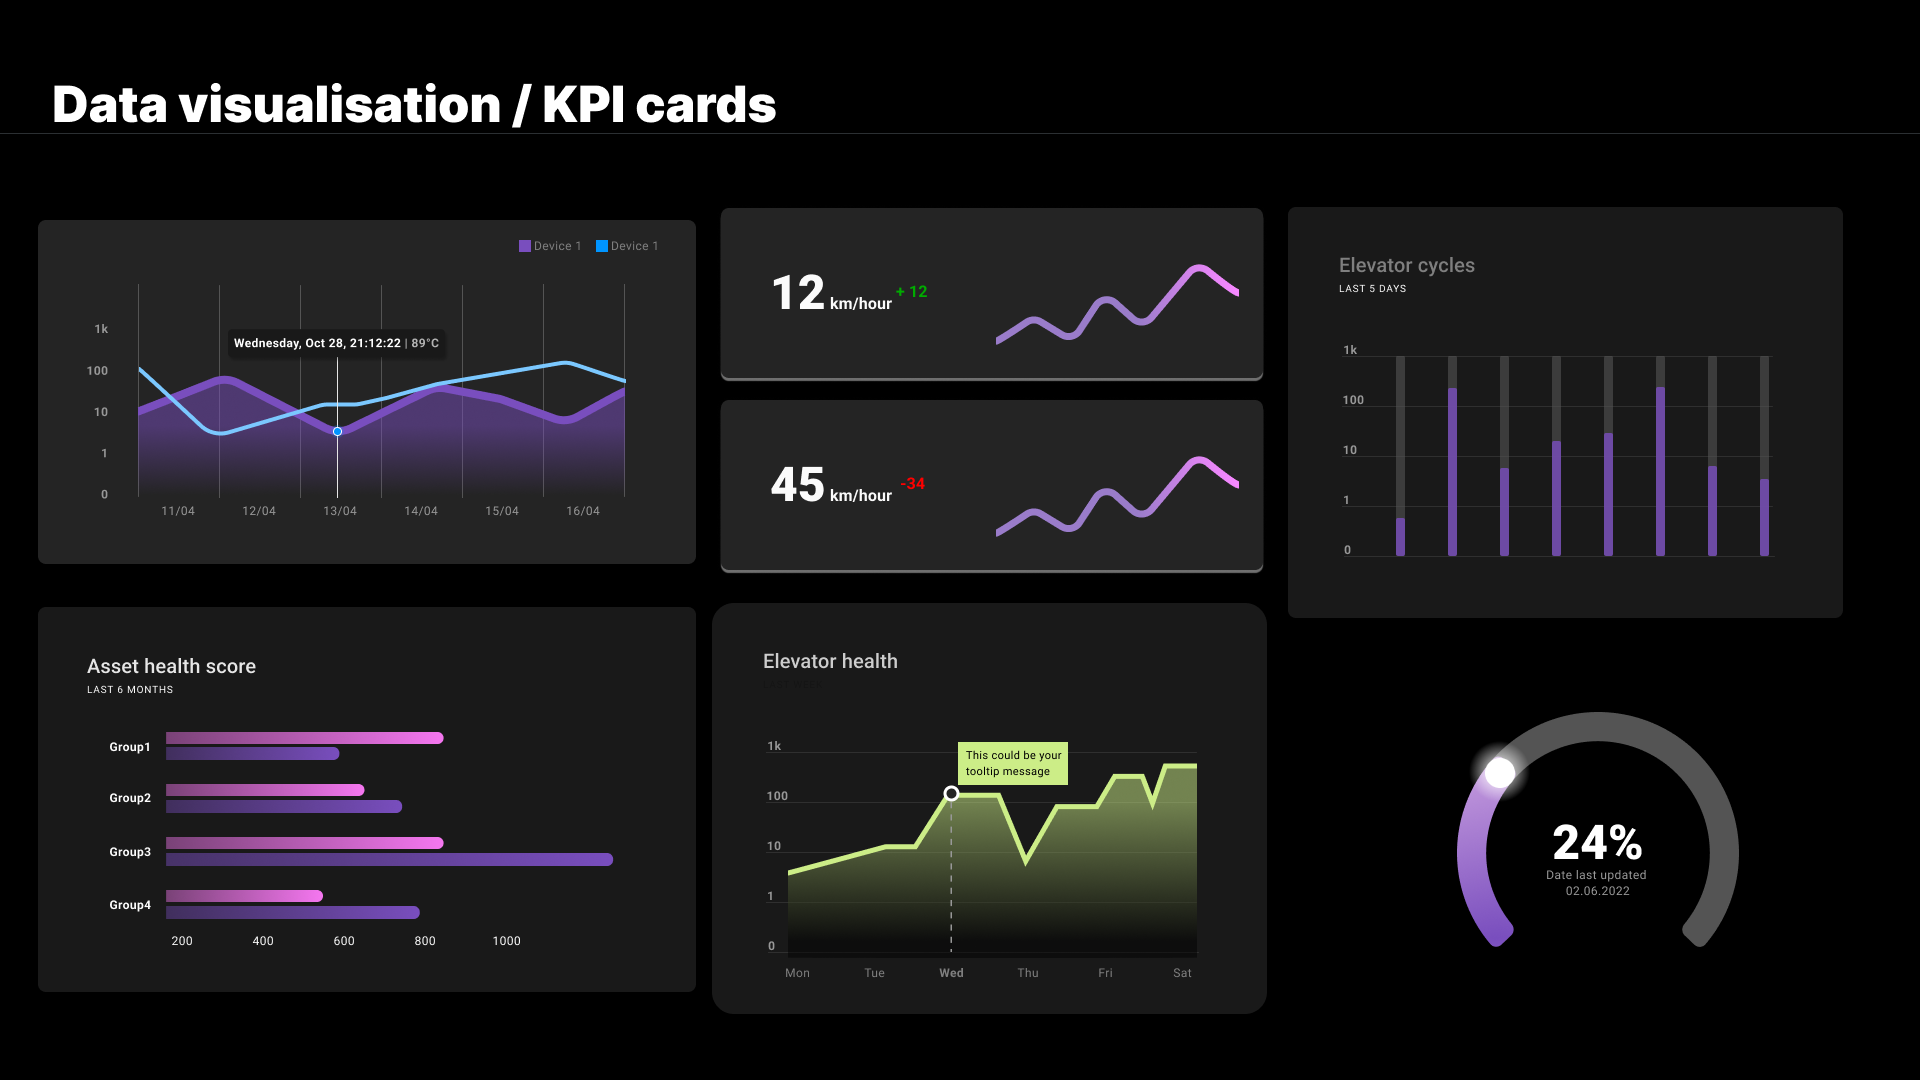
This was part of a past Design System project. The goal was to explore creating UI elements within Figma to build a chart library section for a design system within the framework of an industrial platform product. This involved investigating visual approaches to present data visualizations for tracking progress and showcasing key performance data on a dashboard.
Design System - Dashboard